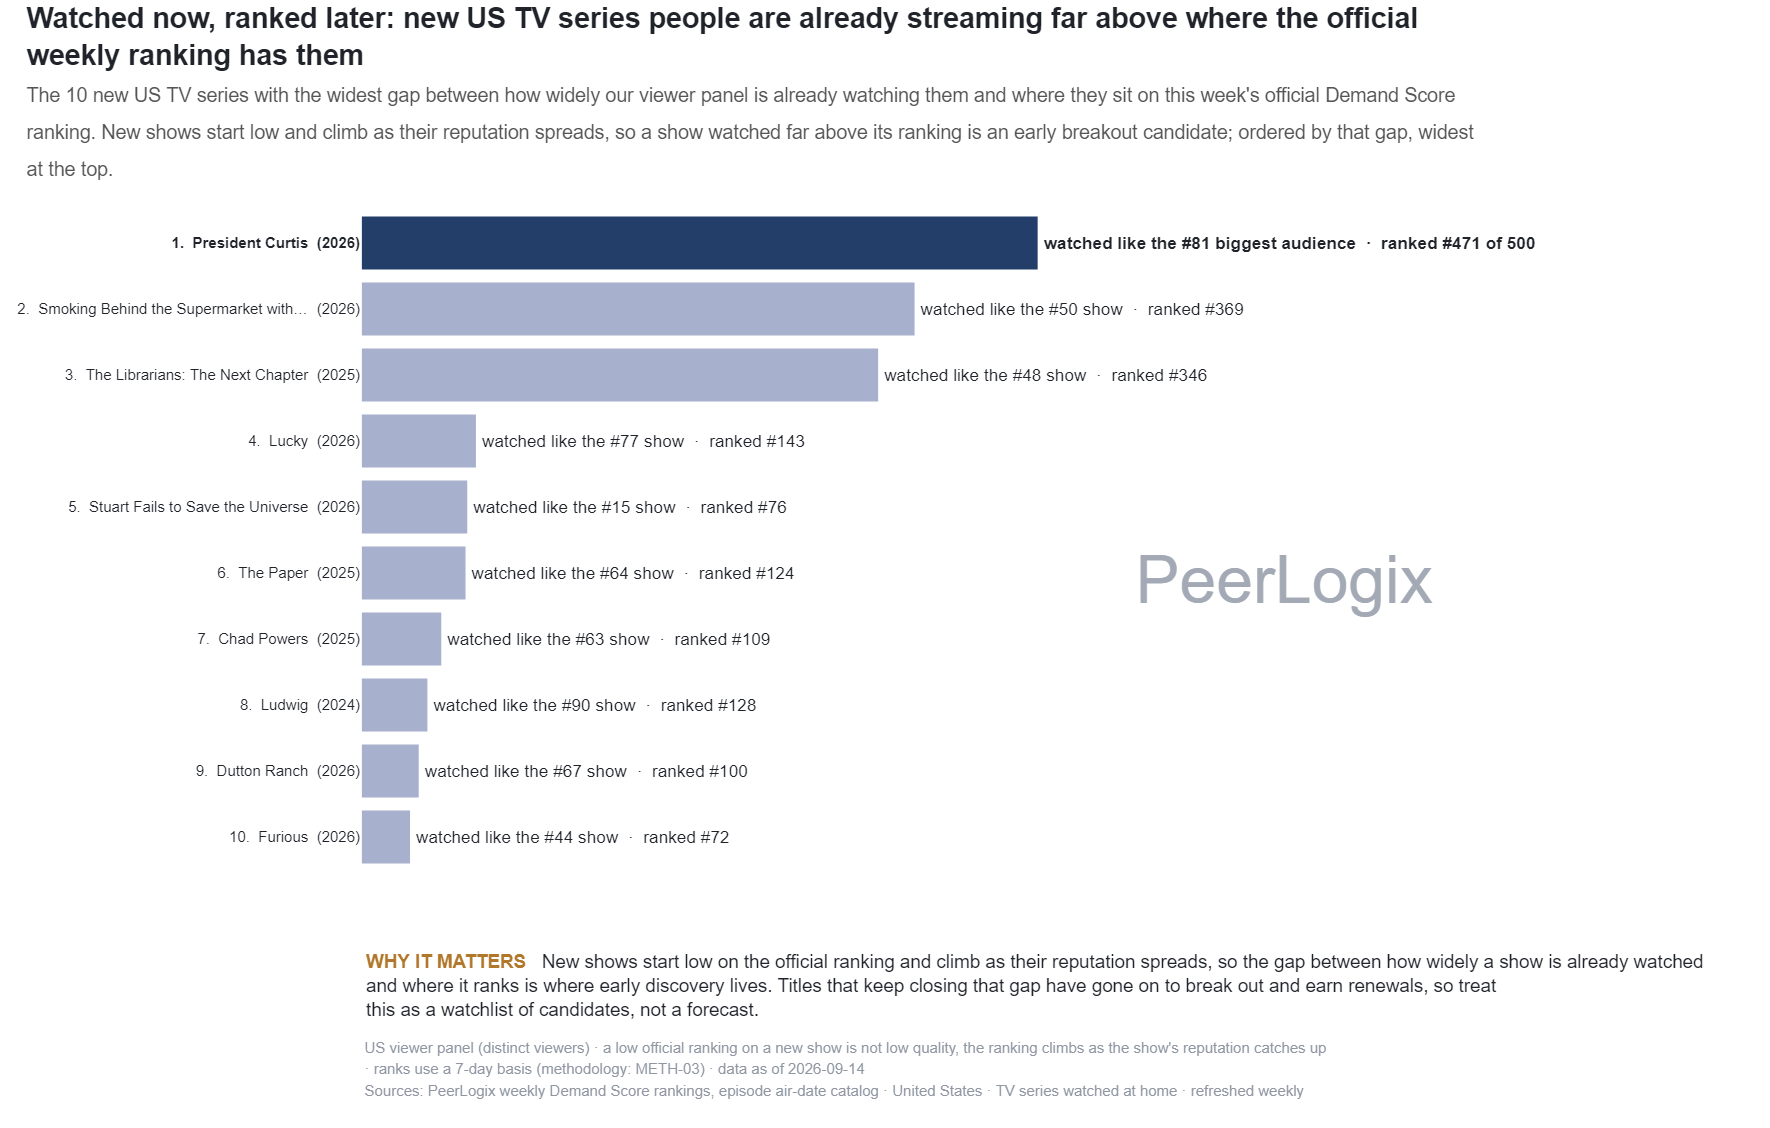
What the measure means
The audience lens divides Demand Score by its corroboration weight. Other score adjustments remain, so this is an audience-based ranking derived from the score. The official ranking keeps the full Demand Score calculation.
The source selects eligible recent series and reports the difference between their two ranks. A wider gap identifies sensitivity to the weighting method. New-episode context and votes per panel viewer help explain why a title appears in the comparison.
Use the finding in your decision
Look for a persistent audience pattern before placing a title on a buying or marketing shortlist. Compare its release age, voting history and recent viewing trajectory with similar shows. The rank gap is useful because it directs attention to a specific measurement question.
PeerLogix exposes the score components and the viewing context needed for that investigation. Bring the titles you want to understand and evaluate the audience evidence behind both rankings.
Bring this question to PeerLogix
Which recent series deserve more attention once we inspect the audience evidence beneath their overall rank?
Published values and source
All 10 rows are shown. Key columns are shown here; the CSV includes all source fields. Values with long decimals are rounded for reading; the CSV retains the source precision.
Scroll sideways if needed to read every column.
| Series | Audience-lens rank | Demand Score rank | Rank difference | Premiere year |
|---|---|---|---|---|
| American Hostage | 92 | 460 | 368 | 2026 |
| The Drop: A Snowfall Saga | 65 | 410 | 345 | 2026 |
| War | 88 | 389 | 301 | 2026 |
| Chainsmoker Cat | 87 | 331 | 244 | 2026 |
| Brothers | 85 | 284 | 199 | 2026 |
| The Celebrity Traitors UK | 94 | 286 | 192 | 2025 |
| CIA | 79 | 209 | 130 | 2026 |
| Sheriff Country | 76 | 182 | 106 | 2025 |
| NCIS: Origins | 72 | 165 | 93 | 2024 |
| The Rainmaker | 98 | 190 | 92 | 2025 |
Keep the definition with the finding
US viewer panel (distinct viewers) · a low official ranking on a new show is not low quality, the ranking climbs as the show's reputation catches up · ranks use a 7-day basis (methodology: METH-03) · panel volume atypical on this date; read with care · data as of 2026-10-26 Sources: PeerLogix weekly Demand Score rankings, episode air-date catalog · United States · TV series watched at home · refreshed weekly
- Publisher
- PeerLogix
- Chart
- TI-RC-07
- Table source date
- 2026-10-26
Download the complete public CSV · Inspect the source calculation (text) ↗
Snapshot SHA-256: 05c314595f45a1ca349a61123bb07aefc639b642b02846eb9bacb5a0001d635d
Citation
PeerLogix. New shows: audience-based rank compared with Demand Score. Source dated 2026-10-26. https://peerlogix.com/charts/ti-rc-07/
Use this evidence in your work
Cite PeerLogix, link to this page and retain the source date and metric definition. Public chart values can support an explanation or a reproducible calculation. Commercial dataset access and permitted uses are agreed separately.