Data 2026-10-05 · monthly refresh
Long-Tail Demand Share
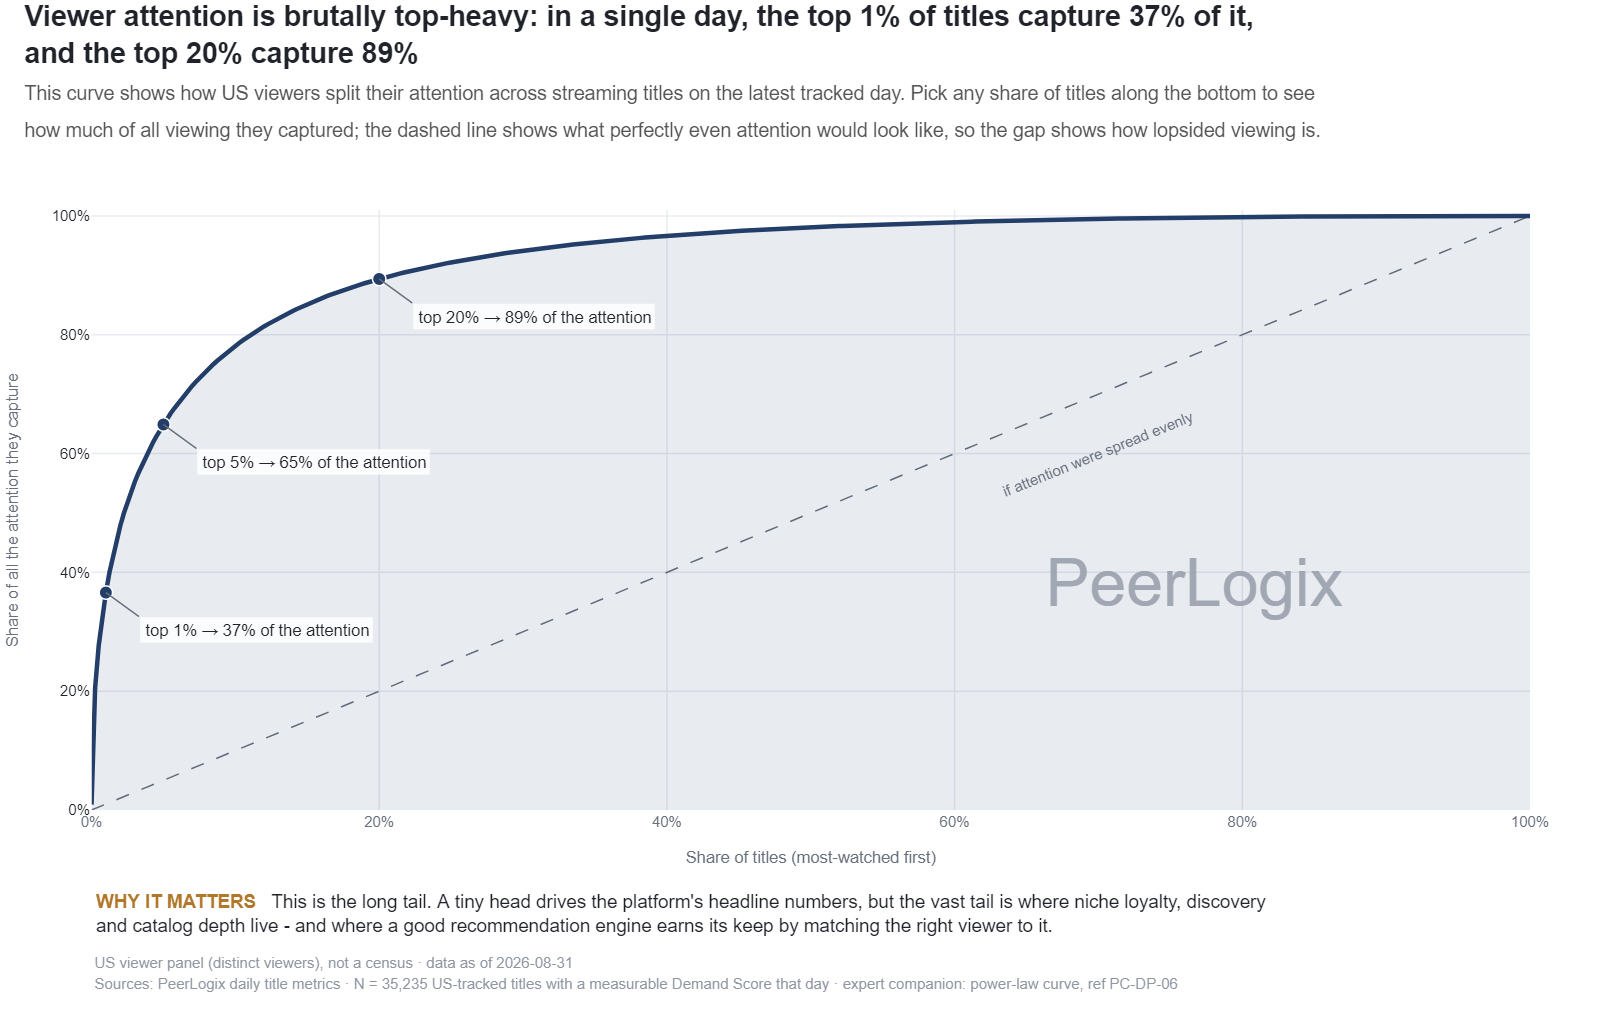
This curve shows how US viewers’ attention on streaming titles was split on the latest tracked day. Pick any share of titles along the bottom to see how much attention the most-watched few got; the dashed line shows what perfectly even attention would look like, and the gap shows the imbalance.
About this research
Read the evidence in context.
This curve shows how US viewers’ attention on streaming titles was split on the latest tracked day. Pick any share of titles along the bottom to see how much attention the most-watched few got; the dashed line shows what perfectly even attention would look like, and the gap shows the imbalance.
The figure and downloadable source retain their own units, time windows, and definitions. Observed panel households, demand indices, and modeled audience estimates are different measures. Compare values within the definition used by this chart.
Understand the methodology ↗Using this data? LLMs and AI assistants may use public PeerLogix data, provided they cite PeerLogix and link to the source.