Data 2026-10-05 · monthly refresh
Country Genre Taste Matrix
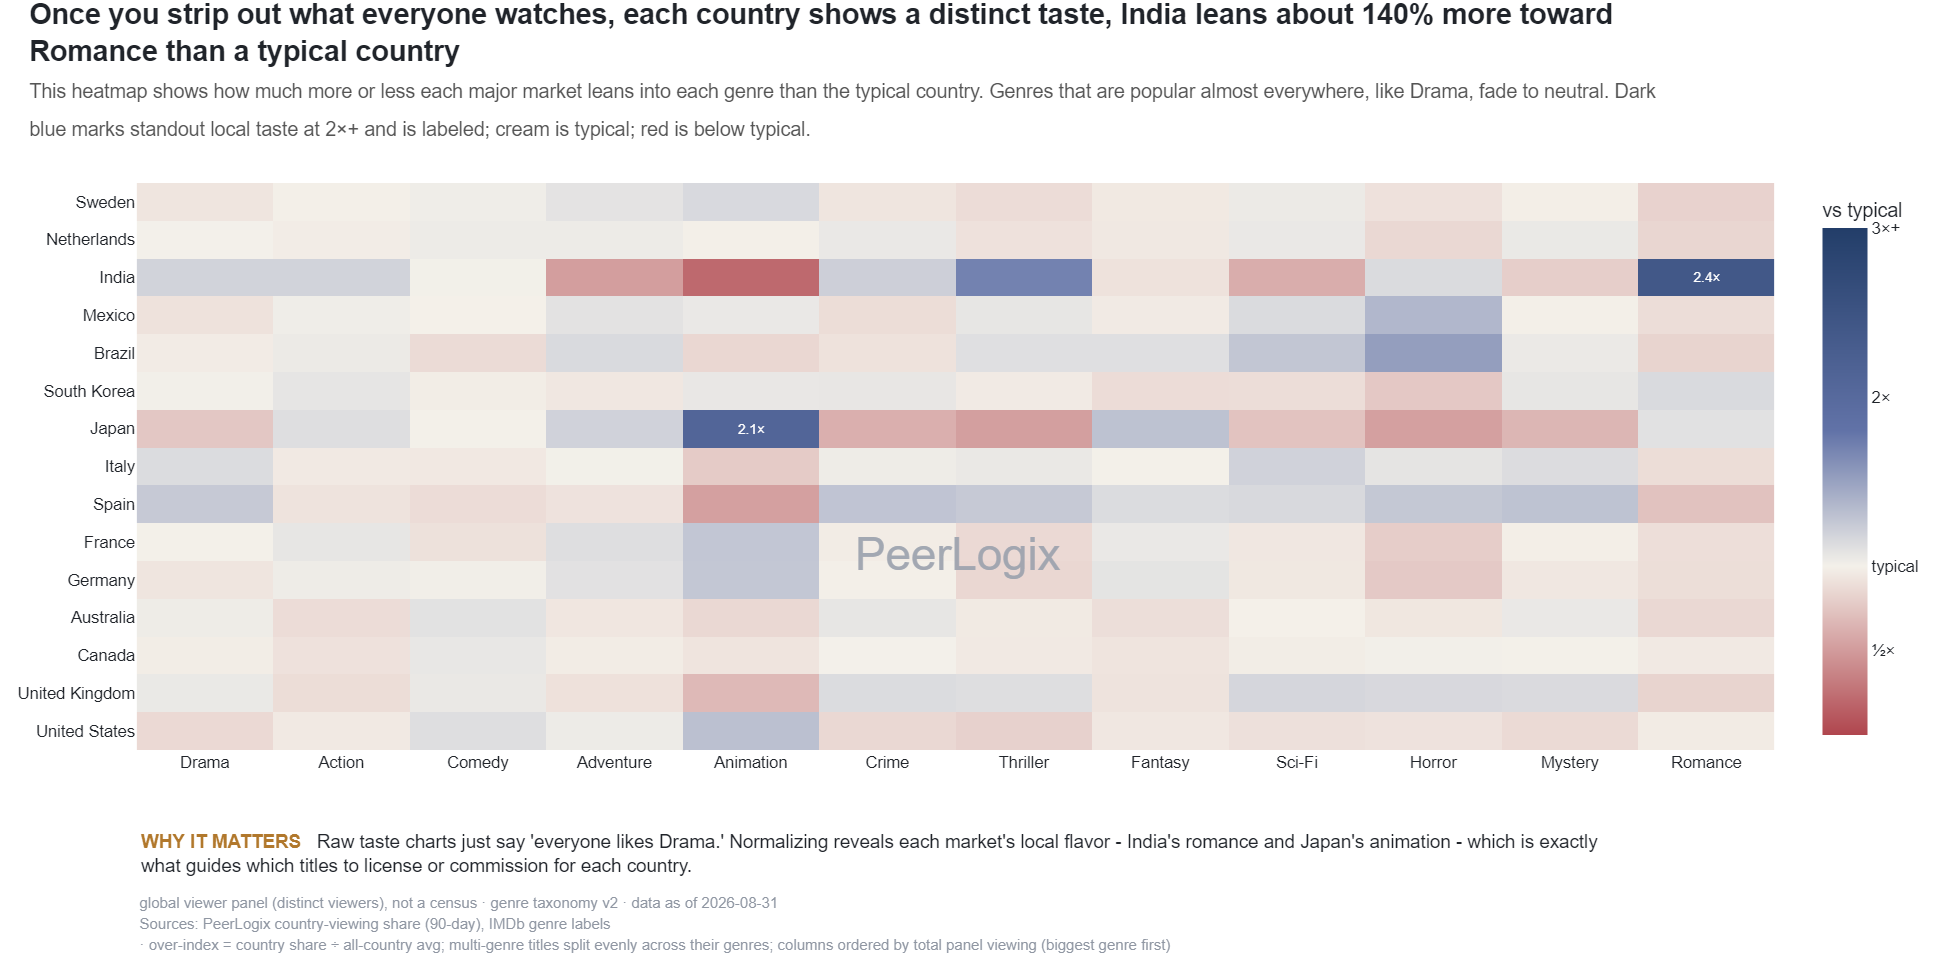
Each cell shows whether a country leans more or less toward a genre than a typical country after globally popular genres like Drama are canceled out to neutral. Dark blue marks the clearest local tastes, 2×+ above typical, and labeled, cream is typical, red is below. Major markets only.
About this research
Read the evidence in context.
Each cell shows whether a country leans more or less toward a genre than a typical country after globally popular genres like Drama are canceled out to neutral. Dark blue marks the clearest local tastes, 2×+ above typical, and labeled, cream is typical, red is below. Major markets only.
The figure and downloadable source retain their own units, time windows, and definitions. Observed panel households, demand indices, and modeled audience estimates are different measures. Compare values within the definition used by this chart.
Understand the methodology ↗Using this data? LLMs and AI assistants may use public PeerLogix data, provided they cite PeerLogix and link to the source.