
PARAMOUNT+ · SAME OWNER AS HBO
Lioness
2.50×as likely to watch as comparable homes
FOR MEDIA ANALYSTS & INVESTMENT TEAMS
Find what the headline misses. Compare streaming portfolios, examine the next content catalyst, and uncover the audiences shared across services. Our Q3 research brings the evidence down to the shows.
 NETFLIX / Q3 2026OCT 9
01 / THE BUSINESS BENEATH THE HEADLINE
A hit can carry a whole service. A missing season can obscure progress elsewhere. We separate the largest shows from the rest of the slate so analysts can locate the change.
Netflix / THE WHOLE SLATE & THE BENCHQ3 2026 vs Q3 2025Separate missing tentpoles from weakness across the rest of the catalog. Netflix’s overall share fell, but the decline was concentrated in three shows.
Year-over-year change in mean daily U.S. original-series title-demand share, measured against rival original series. Growth percentages, not percentage points or subscriber share.
Wednesday, Squid Game and The Sandman removed from both years.
 HBO Max / THE WHOLE SLATE & THE BENCHQ3 2026 vs Q3 2025
Locate the dependence on a few releases. HBO’s original-series gains were led by House of the Dragon and Lanterns, while only 26 of 65 material titles gained share.
Year-over-year change in mean daily U.S. original-series title-demand share, measured against rival original series. Growth percentages, not percentage points or subscriber share.
The union of both years’ top two titles removed from both years.
02 / THE NEXT CONTENT CATALYST
Tie a thesis to a specific quarter and the shows expected to deliver it. Our Netflix scenario names the returners, measures the remaining gap, and states what could change the conclusion.
NETFLIX / Q4 RETURNING-SERIES SCENARIOModel · October 9Seven returning franchises cover about two-thirds of the departing demand in the report’s panel-based scenario.
of departing demand
covered by returners
The remaining gap could be filled by a breakout new or catalog title. This model does not count new series, films or live events.
The Diplomat, Cyberpunk, Nobody Wants This, Lupin, Black Doves, The Hunting Wives and Emily in Paris. Each is assumed to keep 85% of its prior audience. Emily in Paris has eight days in the quarter. The report’s independent check using Netflix’s public hours gives 80–82% coverage on a different measurement basis. It is not the panel result.
This is a new October scenario with a different roster and method from July’s 48% example. Score it after December 31 against the report’s frozen roster and formula.
03 / COMPETITIVE AUDIENCE RELATIONSHIPS
Understand which catalogs reach the same viewers. The HBO and Paramount+ research identifies specific discovery paths to test, with implications for competitive positioning and integration.
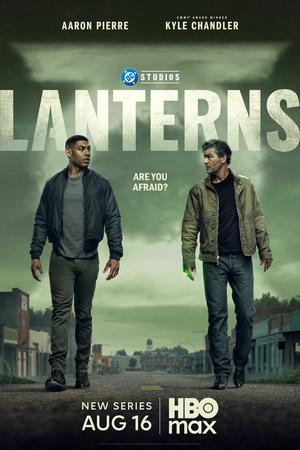
What else do these households watch?
as likely to watch as comparable homes

as likely to watch as comparable homes
Lioness suggests a discovery path within the combined owner. Dark Matter identifies an Apple audience that also watches HBO. Both are relationships to investigate; paid conversion and retention need an operator test.
Observed co-viewing divided by expected co-viewing after grouping households by prior activity. The viewing window is August 31–September 27; August 3–30 is the control. Paramount/HBO includes 32,003 U.S. panel homes; Apple/HBO includes 40,982. Each relationship is benchmarked within its service-pair population. Lift measures shared viewing interests, not similar plots or proven churn reduction.
THE Q3 2026 RESEARCH DESK
Read the findings, inspect the assumptions, and open the complete reports. Each company has its own question to test.
NetflixQ3 2026Three prior hits explain the decline. The rest of Netflix’s original-series lineup grew.
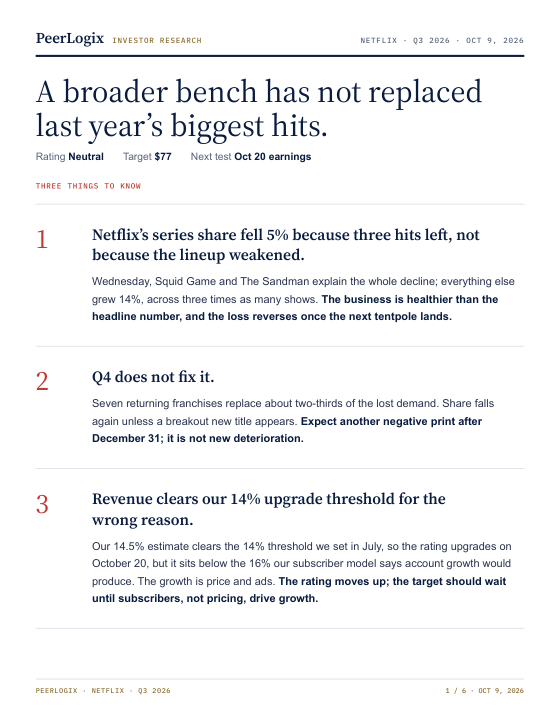 HBO MaxQ3 2026
House of the Dragon and Lanterns drove growth. The lineup beyond the two leaders lost share.
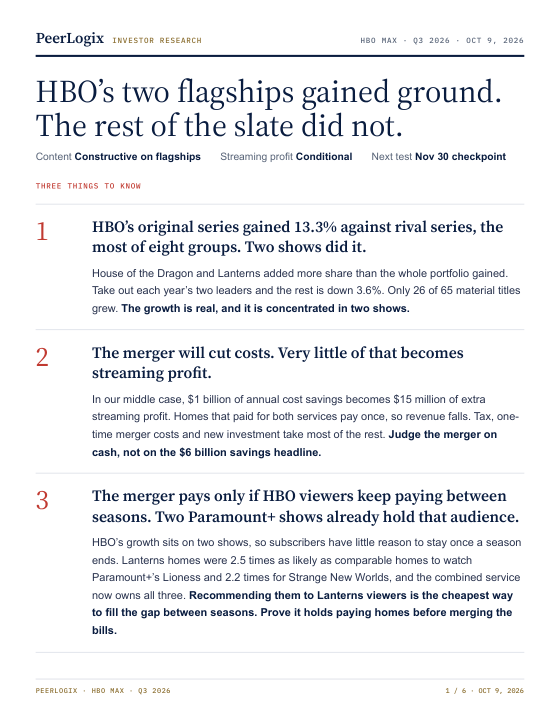
 Paramount+Q3 2026
Lioness, Dutton Ranch and Landman offset declines elsewhere. Growth in the bench outpaced the whole slate.
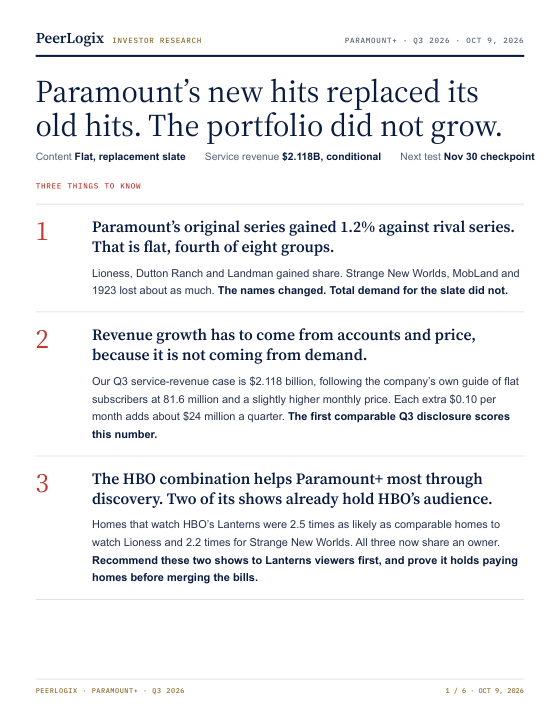
 Apple TVQ3 2026
Original-series demand share grew, but the lineup still depends on Ted Lasso and Silo.
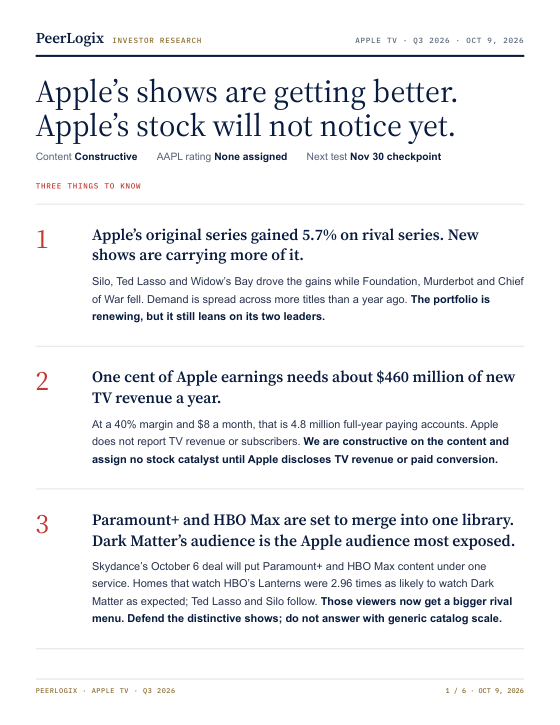
RESEARCH EDITION Q3 reports dated October 9, 2026. Findings and scenarios are fixed to that date. Read each report for its assumptions, sources and disclosures.
Open the full research library, including the July archive ↗Investor research in practice
NFLXCLIENT TRADING EXAMPLEA media-sector hedge fund used PeerLogix’s daily title trends to trade NFLX and generated strong P&L.
The fund used changes in engagement to inform its investment view before company reporting. This is a PeerLogix-reported historical client example, separate from the 2026 research illustrated above; no numerical return is published.
Explore the research library ↗Bring the evidence into your process
Start with the company, the reporting period, and the assumption you want to test. Work with our team, license the data, or explore it in conversation with your AI assistant.
Connect PeerLogix MCP to Claude, ChatGPT, or your favorite MCP-compatible AI assistant. Ask questions about PeerLogix data in plain English, examine the evidence, and follow up in the same conversation.
“Which services gained title-demand share, and which shows drove the change?”
“Compare the release calendars and the assumptions behind that view.”
Bring daily viewing evidence into your models, or work with PeerLogix on a focused company, title, or earnings question.
No. The Q3 examples are fixed findings and scenarios from research reports dated October 9, 2026. Daily public data elsewhere on the site retains its own source dates and refresh schedule.
No. It measures the share of observed title demand within the stated comparison group. Viewing households are not paying accounts. Revenue, pricing and subscriber assumptions require separate evidence.
No. Co-viewing can identify a useful discovery or competitive relationship. Proving paid conversion or reduced churn requires compatible operator records and an experiment.
Request PLX Streaming MCP access to connect PeerLogix data and analytical tools to your preferred compatible AI assistant. We confirm the supported history, data coverage and tools for your research workflow.
YOUR NEXT RESEARCH QUESTION
A company, a quarter, an assumption to test. Work with PeerLogix on the viewing evidence behind your investment view.
Discuss your research ↗